


Overview
This is an educational interactive visualization for learning more about the lognormal distribution.
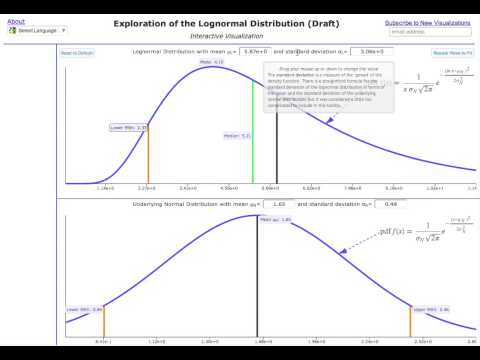
This app is an educational tool to help understand the lognormal distribution. The visualization allows you to play with the various parameters defining the lognormal distribution or the underlying normal distribution. You can dynamically see the impact of changing: * the upper or lower 95th percentiles of either the lognormal or its underlying normal distribution * the median of the lognormal * the mean of the lognormal or the underlying normal distribution * the standard deviation of the lognormal or the underlying normal distribution
4 out of 52 ratings
Google doesn't verify reviews. Learn more about results and reviews.
Details
- Version0.3
- UpdatedMarch 8, 2019
- Size3.1MiB
- LanguagesEnglish
- Developer
- Non-traderThis developer has not identified itself as a trader. For consumers in the European Union, please note that consumer rights do not apply to contracts between you and this developer.
Privacy
Support
For help with questions, suggestions, or problems, please open this page on your desktop browser